
How High Will U.S. Gas Prices Reach in 2026?
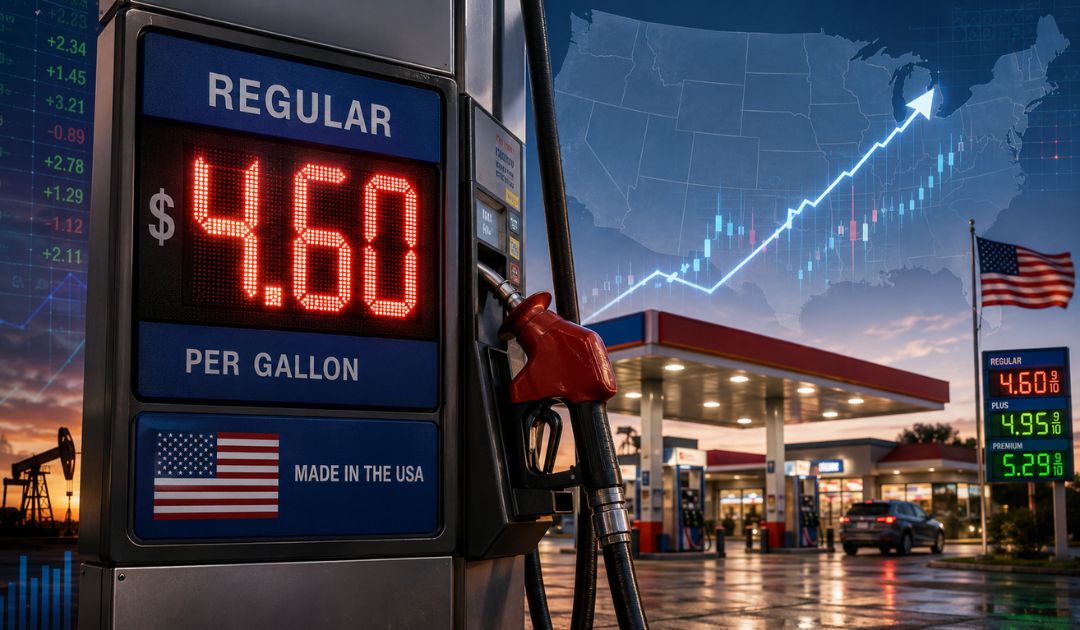
AAA's national average for regular gasoline is near $4.11 per gallon, while prediction markets currently give it about a 58% chance of rising above $4.60 before the end of 2026.
Gas prices in the US are climbing again as oil markets react to war, shipping disruptions and tightening supplies of crude oil and refined fuel. AAA currently reports a national average near $4.11 per gallon for regular gasoline, approximately 90 cents below the record of $5.016 reached on June 14, 2022.
Kalshi traders currently favor at least one move above $4.60 before December 31. The listed probability is about 58%, with Yes contracts offered near 60¢ and No contracts near 42¢. Higher thresholds become less likely, although the market still leaves meaningful chances for prices above $5.00 and even $6.00.
The market depends on the maximum AAA national average, not the price at one station or the average in a high-cost state such as California. One qualifying AAA reading can settle a threshold Yes even when the price falls again shortly afterward.
U.S. Gas Price Market Snapshot
AAA updates its national average daily. Kalshi prices, displayed probabilities, bid and ask values, available quantities and maximum payouts can change throughout the day.
How the Gas Price Contracts Settle
Each contract resolves Yes when AAA reports a national average regular gasoline price above the stated threshold at any time from issuance through December 31, 2026. AAA is the controlling source agency.
The market opened on March 23, 2026 at 8:00 p.m. EDT. When a threshold is reached, the related contract closes at the next scheduled 10:15 a.m., 11:00 a.m. or 3:00 p.m. ET checkpoint. Otherwise, contracts remain open through the year-end deadline. Kalshi lists a projected payout one hour after closing.
These are overlapping contracts. A national average above $5.20 can make the Above $4.60, Above $4.80, Above $5.00 and Above $5.20 contracts all resolve Yes. Readers who are new to event contracts can review how Prediction Markets work before comparing the thresholds.
What Traders Predict for Each Gas Price Threshold
The market currently treats a move above $4.60 as more likely than not. It gives a move above $5.00 about a one-in-three chance, while the highest thresholds remain long-shot outcomes.
| AAA National Average Threshold | Displayed Chance | Yes Price | No Price |
|---|---|---|---|
| Above $4.60 | 58% | 60¢ | 42¢ |
| Above $4.80 | 45% | 46¢ | 56¢ |
| Above $5.00 | 32% | 36¢ | 68¢ |
| Above $5.20 | 20% | 21¢ | 81¢ |
| Above $5.40 | 19% | 22¢ | 82¢ |
| Above $5.60 | 19% | 18¢ | 86¢ |
| Above $5.80 | 19% | 18¢ | 86¢ |
| Above $6.00 | 12% | 14¢ | 88¢ |
| Above $6.20 | 15% | 15¢ | 89¢ |
| Above $6.40 | 8% | 11¢ | 92¢ |
| Above $6.60 | 10% | 11¢ | 91¢ |
| Above $6.80 | 6% | 8¢ | 93¢ |
| Above $7.00 | 7% | 8¢ | 93¢ |
Displayed chances can temporarily look uneven across nearby thresholds because each contract has its own last trade, liquidity and bid-ask spread. A higher threshold shouldn't be interpreted as fundamentally more likely than a lower threshold simply because one displayed percentage is temporarily higher.
Why Some Higher Thresholds Show an Unexpected Percentage
The Above $6.20 contract displays a higher chance than Above $6.00, and Above $7.00 displays a slightly higher chance than Above $6.80. That doesn't mean the market believes a higher price is easier to reach.
These values come from separate order books. Thin trading, an older last transaction or a wide spread can make the displayed percentages temporarily inconsistent. The live bid, ask and available contract quantity provide more context than the headline percentage alone.
What a $100 Gas Price Prediction Can Pay
The potential return rises as the selected threshold becomes less likely. A correct $100 Yes position on Above $4.60 currently pays much less than a correct $100 position on Above $7.00 because traders consider the first outcome far more realistic.
| Prediction | Amount Entered | Maximum Payout | Amount Above $100 |
|---|---|---|---|
| Above $4.60: Yes | $100.00 | $159.73 | $59.73 |
| Above $4.60: No | $100.00 | $217.25 | $117.25 |
| Above $4.80: Yes | $100.00 | $205.28 | $105.28 |
| Above $5.00: Yes | $100.00 | $253.10 | $153.10 |
| Above $5.20: Yes | $100.00 | $361.08 | $261.08 |
| Above $7.00: Yes | $100.00 | $859.96 | $759.96 |
The maximum payout includes the original $100. The amount above the purchase isn't realized profit unless the contract settles correctly. Prices, order depth and transaction fees can change the final result.
Readers can review our Kalshi Prediction Markets overview for more information about contract pricing, settlement and trading risk.
Selected $100 Maximum Payouts
These examples use the live order panels shown with $100 entered. They aren't guaranteed quotes and can move before checkout.
Why Gas Prices Are So Unstable in 2026
The current spike is mainly an international supply problem. Gasoline is refined from crude oil, and the price at U.S. pumps reacts to global crude benchmarks, refinery availability, shipping costs and the supply of finished gasoline.
Strait of Hormuz Disruption
Approximately one-fifth of global petroleum supply normally moves through the strait. Restricted tanker traffic removes reliable supply and adds a large geopolitical risk premium.
U.S.-Iran Conflict
Renewed attacks and failed truces keep oil markets focused on the possibility of deeper production losses and longer shipping interruptions.
Red Sea Shipping Risk
Houthi attacks and threats against energy routes increase freight, insurance and rerouting costs even when oil continues moving.
Russia and Ukraine
Damage to refineries, ports and export infrastructure reduces the global supply of crude oil, gasoline and diesel.
Tight Refining and Inventories
Low gasoline inventories and limited refining capacity leave less protection against outages, import delays and sudden demand increases.
Summer Fuel and Driving
Summer gasoline costs more to manufacture, while vacation travel and seasonal driving normally increase consumption.
Reuters reports that Brent crude ended the latest completed session at $96.78 per barrel and West Texas Intermediate at $89.31. Oil fell sharply when reports suggested that China was pushing for renewed U.S.-Iran peace talks, showing how quickly prices can react to diplomacy.
What the AAA National Average Actually Means
AAA's national average estimates the retail price of regular gasoline across the United States. AAA uses pricing data supplied by the Oil Price Information Service, which gathers daily observations from as many as 120,000 stations in cooperation with WEX.
The figure isn't a simple average of 50 state averages, and it doesn't mean most drivers pay the exact published number. California, Hawaii and Washington can be much higher, while Gulf Coast and central states can remain substantially lower.
California affects the national number because its stations are included in the dataset, but it doesn't control the result. Lower-priced states offset part of California's impact. California prices are higher because of state taxes and fees, environmental compliance costs, a specialized gasoline blend, limited pipeline connections and dependence on a relatively small group of in-state refineries.
How 2026 Compares With Earlier Gas Price Spikes
Presidents can influence sanctions, reserve policy, energy regulation and diplomacy, but they don't directly set retail gasoline prices. The largest short-term movements usually come from global crude supply, wars, recessions, demand, refinery capacity and inventories.
| Period | Gas Price Movement | Main Causes |
|---|---|---|
| George W. Bush, 2008 | Regular gasoline reached about $4.11 in July before falling near $1.70 in December. | WTI approached $145 per barrel, followed by a financial crisis and collapse in petroleum demand. |
| Barack Obama, 2011 to 2014 | Prices remained above $3 for long periods and reached about $3.94 in April 2012. | Arab Spring disruption, lost Libyan exports, limited spare capacity and concern surrounding Iran. |
| Obama, late 2014 to 2016 | Prices fell toward and below $2 in many locations. | Rapid U.S. production growth, weaker demand and OPEC's decision to maintain output. |
| Donald Trump, 2020 | U.S. regular gasoline averaged $2.17 and reached about $1.77 in April. | COVID-19 restrictions caused driving and gasoline consumption to collapse. |
| Joe Biden, 2022 | AAA reached its record of $5.016 on June 14. | Post-pandemic demand, tight inventories, constrained refining and Russia's invasion of Ukraine. |
| Donald Trump, 2026 | AAA is near $4.11 and approximately 90 cents below the 2022 record. | Iran conflict, Hormuz disruption, Red Sea risk, refinery losses and tight gasoline supply. |
Although the 2022 price is the highest nominal AAA reading, the 2008 spike hit consumers harder after inflation is considered. The national average reached approximately the same level as today 18 years ago, when household incomes and general prices were much lower.
What Could Bring Gas Prices Back Down
A Durable Hormuz Reopening
Normal tanker traffic would reduce the geopolitical premium and allow Middle Eastern crude and refined fuel to reach global buyers more reliably.
Restored Production and Refineries
Restarting facilities that were shut, damaged or isolated would increase the supply available to refiners and fuel distributors.
More OPEC+ and Non-OPEC Supply
Additional production from Saudi Arabia, the United Arab Emirates, the United States, Canada and Brazil can replace lost barrels.
Rebuilding Gasoline Inventories
Higher refinery runs, more imports and weaker demand would give distributors more protection against future disruptions.
The End of Summer Demand
Driving normally slows after summer, and refiners move toward less expensive winter-grade gasoline.
Slower Economic Growth
Lower travel, shipping and industrial demand can reduce fuel prices, although a recession is an undesirable path to cheaper gasoline.
The EIA Forecast Is a Conditional Reopening Scenario
The EIA's July outlook projected Brent near $70 per barrel in the fourth quarter and U.S. gasoline near $3.40 per gallon. That forecast assumed improving Hormuz traffic and returning Middle Eastern production. Renewed fighting means those numbers should be treated as a scenario that can become realistic if supply routes normalize, not as a certain current forecast.
What Could Push the National Average Above $5 or $6
A prolonged Hormuz shutdown, damage to major Gulf production facilities, a Red Sea blockade, additional Russian refinery losses or an extended U.S. refinery outage can push crude and wholesale gasoline sharply higher.
The highest contracts require several problems to occur together or one extremely severe supply shock. Above $7 remains possible under the rules, but the current 7% market probability treats it as a remote outcome.
Our Prediction for How High Gas Prices Will Reach
Like everyone else, we can't know the final peak because several months remain and the outcome depends heavily on wars, diplomacy and shipping access. We still remember the AAA national average reaching $5.016 during the Biden administration in 2022. Today's average is about 90 cents lower, but it remains painful for drivers.
We also haven't forgotten July 2008, when regular gasoline reached approximately $4.11 per gallon. That was 18 years ago, so the price had a greater effect on household purchasing power than the same nominal number does today.
We believe the current spike is driven mainly by international conflict, especially restricted traffic through the Strait of Hormuz. The Russia-Ukraine war and disruptions to other oil and refined-product routes add more pressure. Our related Strait of Hormuz Traffic analysis placed the chance of normalization before 2027 near 44% at publication.
Our central prediction is that AAA's national average briefly moves above $4.60 but remains below $5.00. We expect a peak in the $4.60 to $4.90 range if current disruptions continue through part of the summer and then begin easing. A durable ceasefire and normal tanker traffic can keep the price below that range, while another major supply shock can push it above $5.
We remain optimistic that the major conflicts, including the war involving Iran, move toward a resolution before the end of the year. That view makes the $6 and $7 thresholds unlikely in our opinion. This is an editorial prediction based on the current information, not a guarantee or financial advice.
Predict How High U.S. Gas Prices Will Reach
Review the live thresholds, Yes and No prices, available contracts and complete AAA-based settlement rules before choosing a position.
View Kalshi MarketsAffiliate disclosure: Bonus Predictions may earn a commission when an eligible user signs up or trades through this link. This doesn't change the price paid by the user or our editorial analysis.
The Market Favors Above $4.60, but Not a New Record
Gas prices are close enough to $4.60 that another oil spike, refinery outage or breakdown in diplomacy can settle the first threshold. The current market gives that outcome a better-than-even chance.
A return above $5 requires a larger or longer supply disruption. Prices above $6 or $7 likely need a severe combination of closed shipping routes, lost production and limited refining capacity.
Our forecast is a 2026 national peak between $4.60 and $4.90, followed by lower prices when shipping normalizes, inventories rebuild and summer demand fades.
Sources

Join the Discussion
Leave a Comment on This Story